Looking for AI sustainability consulting? See our AI for Sustainability Research consulting service. The article below is our analysis of Anthropic’s economic data on AI usage across sustainability work.
How much do sustainability professionals actually use AI? The honest answer is that no single data cut will tell you. The work sits inside broad occupational buckets that include many other kinds of consulting, and it spans tasks that often aren’t explicitly labelled “sustainability” at all. I went looking in the raw data anyway, and the result is a consistent signal visible from two different angles.
I downloaded the Anthropic Economic Index (AEI) dataset from huggingface.co/datasets/Anthropic/EconomicIndex and ran two parallel analyses for AI usage in sustainability consulting. The first looked at occupations the US labor taxonomy associates with sustainability work. The second looked at tasks whose text mentions sustainability, environment, carbon, circular economy, and related keywords. Each lens has weaknesses the other covers. Both point in the same direction, with some important nuance. This is the second piece in a mini-series I started with a broader AEI read on generative AI usage.
The short version: sustainability professionals show lower AI co-occurrence than their peers in other fields, and the gap is largest for tasks involving values, policy, and strategy. Modeling and forecasting are the exception. The rest of this piece shows the evidence and then engages seriously with a hypothesis about why.
Key Takeaways
- Two complementary lenses on the same question: sustainability occupations sit at the economy-wide mean for AI exposure (7.5%), but sustainability-specific tasks show 3 to 9 times less AI co-occurrence than structurally identical non-sustainability tasks.
- The gap between sustainability and equivalent non-sustainability tasks widens sharply where values and judgment matter most: 9x for planning and strategy, essentially no overlap for policy and advocacy, only 1.4x for computational modeling.
- The resistance hypothesis (sustainability professionals are more cautious about AI for ethical, credibility, and values reasons) fits the task-type gradient better than the alternative explanations. Tool mismatch and adoption lag probably play smaller roles.
- Sustainability professionals are likely getting AI leverage on the generic analytical half of their work and leaving value on the sustainability-specific half. Closing that gap is a readily available move.
What the Anthropic Economic Index measures
The AEI is a dataset Anthropic publishes roughly every quarter, built from anonymized Claude.ai and first-party API conversations mapped to the US Department of Labor’s O*NET occupational taxonomy. The occupation and task rankings here draw on the releases that carry O*NET task-level detail, namely the March 2026 Learning curves release, the January 2026 Economic primitives release, and the earlier February 2025 O*NET task mappings. I also re-ran the headline check against the most recent release, the June 2026 Cadences data, which reproduces the same split. More on that below.
Two metrics do most of the work in what follows.
| Metric | What it measures | What it is NOT |
|---|---|---|
| Observed exposure (job level) | How prominently an occupation’s tasks appear in Claude conversation clusters | A real-world AI adoption rate for that job |
| Task penetration | How prominently a specific task statement appears in Claude conversations | The share of real-world task instances done with AI |
| Interaction type | Whether users delegate (directive) or collaborate (iteration, feedback, validation, learning) | The quality or outcome of the interaction |
The caveat that frames everything below. AEI captures Claude.ai and first-party Anthropic API usage only. ChatGPT, Gemini, Microsoft Copilot, and specialist sustainability platforms (Watershed, Persefoni, Sphera, Normative) are invisible in this data. Every number here describes Claude usage patterns, not total AI adoption. I treat the findings as a directional signal and a lower bound, not an adoption rate.
Sustainability in cross-sector context
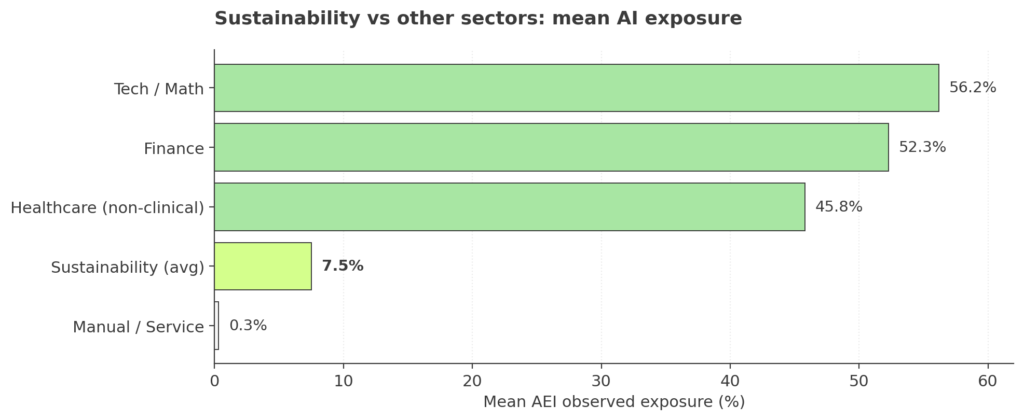
Before zooming into the two lenses, the broad shape. On AEI’s measurement, sustainability-relevant occupations collectively sit right around the economy-wide mean for AI exposure, and about 7x below tech and finance.
| Sector | Representative occupations | Mean exposure |
|---|---|---|
| Computer/Math | Programmers, DBAs, QA engineers, web developers | 56.2% |
| Finance | Market research analysts, financial analysts, accountants | 52.3% |
| Healthcare (non-clinical) | Medical records, transcription, medical coding | 45.8% |
| economy-wide average | 7.7% | |
| Sustainability-relevant jobs | Environmental scientists, planners, CSOs, compliance officers | 7.5% |
| Manual/Service | Solar installers, recyclable collectors, landscapers | 0.3% |
Three readings drop out of this. Tech, finance, and non-clinical healthcare are all roughly 6 to 7 times more AI-exposed than sustainability occupations on this dataset. Sustainability collectively lands on the economy-wide mean, which on the face of it looks unremarkable. The internal range is the more interesting finding, and the two lenses below show where the variance comes from.
The shape replicates across other sources. S&P Global reports 49% of large-cap companies running sustainability AI initiatives vs 26% of small caps. BSR’s 2025 research documents adoption concentrated in a small cluster of leading firms. Microsoft’s Work Trend Index puts general knowledge-worker AI adoption at 75%, which is a long way above what AEI shows for sustainability specifically.
Lens 1: The occupation view
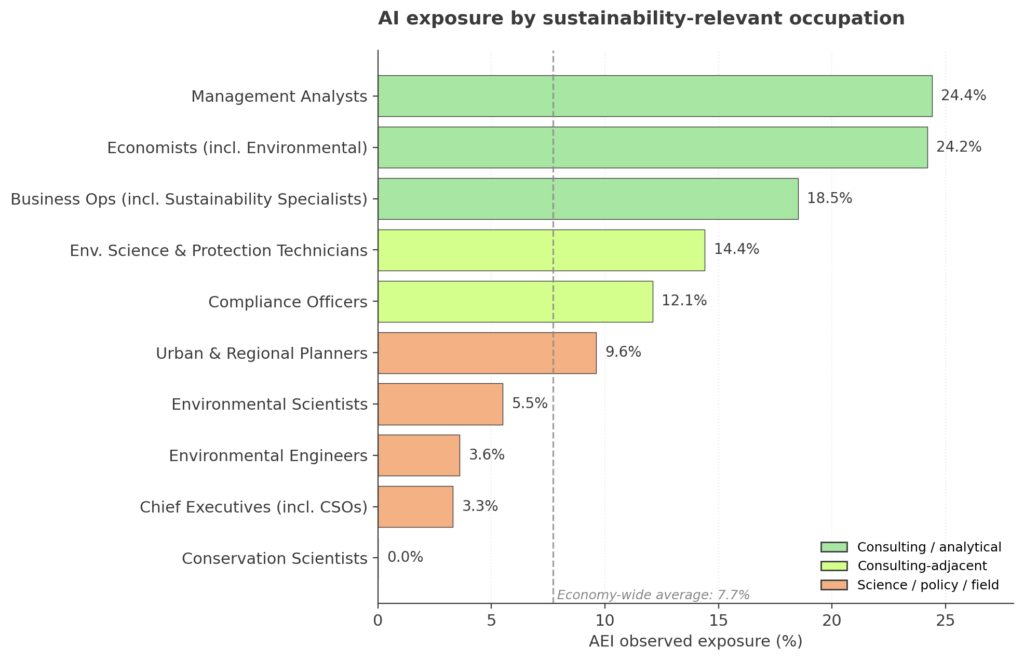
The occupation lens filters AEI’s 756 broad job categories for those that officially carry sustainability work. The results are informative, but read them with the caveat that these categories contain a lot of non-sustainability work too.
| Occupation | Exposure | Rank (of 756) |
|---|---|---|
| Management Analysts (includes sustainability consultants, plus many others) | 24.4% | #94 |
| Economists (includes Environmental Economists, plus many others) | 24.2% | #96 |
| Business Operations Specialists (includes Sustainability Specialists) | 18.5% | #128 |
| Environmental Science and Protection Technicians | 14.4% | #151 |
| Compliance Officers (includes Environmental Compliance Inspectors) | 12.1% | #165 |
| economy-wide average: 7.7% | ||
| Urban and Regional Planners | 9.6% | #189 |
| Environmental Scientists and Specialists | 5.5% | #243 |
| Environmental Engineers | 3.6% | #287 |
| Chief Executives (includes Chief Sustainability Officers) | 3.3% | #290 |
| Conservation Scientists | 0.0% | #684 |
What this does NOT prove. Sustainability consultants are officially classified under Management Analysts, but Management Analysts is a massive bucket that includes strategy, operations, M&A, and many other consulting specialties. The 24.4% figure reflects all of them. It is not a statement that sustainability consultants specifically hit that number.
What this DOES usefully tell us. It sets an upper-bound reference for the professional families sustainability consultants belong to. If sustainability consultants behaved exactly like the average Management Analyst, their AI exposure would be around 24%. The question is whether they do. The task lens below suggests they probably don’t.
On the other side of the table, the environmental science occupations (Environmental Scientists, Environmental Engineers, Conservation Scientists) are more homogeneous buckets, and there the signal is cleaner. These categories run well below the economy mean on measured AI exposure.
Lens 2: The task view
The task lens takes a different cut. Instead of grouping by occupation, I filtered the 18,000 task statements in AEI for keywords that indicate sustainability content: carbon, emissions, sustainability, circular economy, recycling, biodiversity, renewable, environment, ecology, climate change, decarbonization, net zero, life cycle, greenhouse gas, pollution, habitat, natural resource, and related terms. That produced 689 sustainability-flavored tasks.
The baseline for comparison is every other task in the dataset. The comparison is not perfect either, because a sustainability consultant still performs plenty of “generic” tasks that wouldn’t match these keywords. But taken together with the occupation lens, the two cuts bracket the real answer.
At the aggregate level, sustainability-flavored tasks show substantially lower AI co-occurrence than average tasks. The mean penetration across 689 sustainability tasks is 2.5%, versus 8.8% across the 16,700+ non-sustainability tasks. Only 2.7% of sustainability tasks have any measurable AI penetration, compared with 10% of non-sustainability tasks.
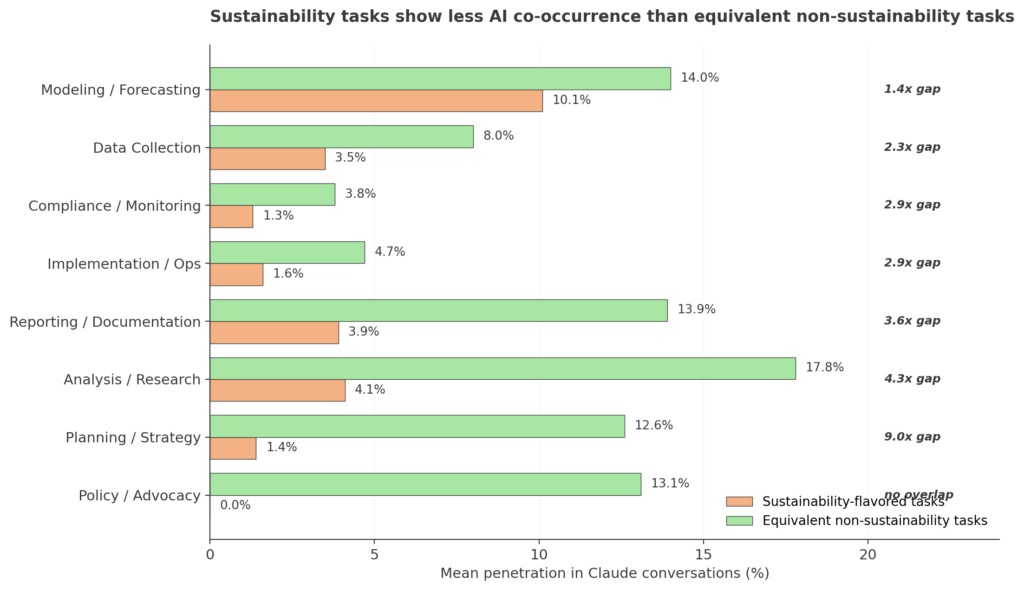
The more revealing cut compares tasks by their cognitive function. I grouped both the sustainability and non-sustainability task pools into eight task types, then compared penetration within each type.
| Task type | Sustainability tasks | Equivalent non-sustainability tasks | Gap |
|---|---|---|---|
| Modeling / Forecasting | 10.1% | 14.0% | 1.4x |
| Data Collection | 3.5% | 8.0% | 2.3x |
| Compliance / Monitoring | 1.3% | 3.8% | 2.9x |
| Implementation / Operations | 1.6% | 4.7% | 2.9x |
| Reporting / Documentation | 3.9% | 13.9% | 3.6x |
| Analysis / Research | 4.1% | 17.8% | 4.3x |
| Planning / Strategy | 1.4% | 12.6% | 9.0x |
| Policy / Advocacy | 0.0% | 13.1% | no overlap |
The pattern is hard to miss. When the cognitive task is largely computational (modeling, forecasting), the sustainability-vs-rest gap almost closes. When the task involves judgment, values, or policy framing (planning, advocacy), the gap opens up dramatically. Reporting and analysis sit in between.
This is the strongest finding in the dataset, and it is meaningful because it holds the task type constant. A generic planning task and a sustainability planning task are cognitively similar work. The AEI data shows the sustainability version has nine times less AI co-occurrence. That is not an artifact of cognitive complexity. It is about which domain the planning happens in.
Where the two lenses converge
Neither lens cleanly isolates sustainability consultants. The occupation view over-includes non-sustainability consulting work in the same SOC buckets. The task view under-includes the generic analytical work sustainability consultants do every day that wouldn’t trip a sustainability keyword.
The actual answer for sustainability professionals likely sits between these two bounds.
- Upper bound from occupations. If sustainability consultants behaved like their broader professional family, AI exposure would look like 15 to 25%.
- Lower bound from tasks. If sustainability consultants used AI only on sustainability-specific work, exposure would look like 2 to 5%.
- The signal from both. Sustainability-flavored tasks across all occupations show 3 to 9 times less AI co-occurrence than structurally identical non-sustainability tasks. This is the cleanest pattern in the data.
A reasonable read is that sustainability professionals are using AI at rates closer to the lower bound than the upper bound for sustainability-specific work, and closer to the upper bound for the generic analytical work they also do. That is consistent with the task-level gap widening where the work gets more domain-specific and more values-laden.
The newest data keeps this reading intact. The June 2026 release ranks occupations by their share of Claude work usage rather than the earlier exposure measure, and the same divide appears. Management Analysts and Environmental Scientists both sit inside the top 160 of the 740 tracked occupations, well within the upper quarter. The science, policy, and stewardship roles cluster near the floor. Conservation Scientists, Environmental Compliance Inspectors, Climate Change Policy Analysts, and Environmental Restoration Planners all register at or near zero, and Chief Sustainability Officers land fourth from the bottom of every occupation Anthropic tracks. Two professions, one job title, still.
Testing the resistance hypothesis
One hypothesis worth taking seriously is that sustainability professionals, for a mix of professional and personal reasons, are more cautious about AI than their peers. They care about the environmental footprint of data centers, about ethical sourcing of training data, about greenwashing risk, and about the credibility cost of a hallucinated statistic in a sustainability report. That disposition could translate into slower or more selective adoption. For practitioners who do adopt AI but want to minimise their compute footprint, How Claude Code Skills Cut AI Energy Use walks through the specific Claude Code patterns that cut energy use most.
The task-type gradient is the most directly relevant evidence. If the resistance hypothesis is right, you would expect the gap to widen where values and judgment matter most. That is what the data shows. Policy and advocacy sustainability tasks have essentially no AI co-occurrence. Planning and strategy tasks show a 9x gap. Computational modeling, where the ethical surface is smallest, shows only a 1.4x gap. The pattern fits the hypothesis.
It is not the only possible explanation, and intellectual honesty requires naming the alternatives.
- Tool fit. General LLMs lack deep domain knowledge of sustainability frameworks (CSRD, GRI, ESRS, LCA methodology, ESPR). Professionals who rely on precise framework application may find AI output unreliable enough to avoid it.
- Specialist platforms. The sustainability software stack includes Watershed, Persefoni, Sphera, Normative, and many others. Sustainability professionals may be using embedded AI inside those tools rather than Claude directly, which this dataset cannot see.
- Credibility risk asymmetry. A hallucinated citation in a marketing deck is embarrassing. A hallucinated citation in an ESG disclosure that gets audited is a career event. Higher stakes may produce more caution, independent of personal values.
- Adoption lag. Sustainability is a comparatively newer professional field with a slightly different demographic profile than tech, finance, or marketing. General AI adoption may simply arrive more slowly.
All four explanations are probably partially true. The task-type gradient is most cleanly explained by resistance or by credibility risk asymmetry, less well by tool fit (which would predict a more uniform gap across all task types) or by adoption lag (same problem). The reality is likely a mix, with the mix shifting by individual and sub-field.
The honest conclusion. Sustainability professionals do appear to use AI at lower rates than peers doing equivalent work, and the gap widens where ethics and values become more central to the task. Whether that is principled resistance, pragmatic caution, tool mismatch, or simple lag, the net effect is the same. There is more room to adopt than most sustainability professionals are currently taking advantage of, and there is a live debate worth having about where the resistance is protecting craft and where it is just leaving leverage on the table.
What this means for sustainability professionals
The dual-lens reading suggests a few practical implications, without turning this into a pitch.
First, the baseline is probably higher than it feels. If your professional family (Management Analysts, Economists, Business Ops) has AI exposure in the 18 to 24% range, and your sustainability-specific work is at 3 to 5%, you are likely getting leverage on the generic half of your job and leaving value on the sustainability-specific half. That is an adoption gap within your own workflow that is addressable.
Second, augmentation is the realistic operating model. Across the sustainability tasks where AI does show up, collaborative interactions (iteration, feedback loops, validation, learning) dominate. The economy-wide baseline for augmentation is around half of all usage, and the sustainability-analytical occupations run well above it. In the June 2026 data, Management Analysts sit at 55% augmentation, Sustainability Specialists at 62%, and Economists at 73%, all above the roughly 51% economy-wide figure. In other words, when sustainability professionals use AI, they tend not to delegate. They iterate. That matches the resistance hypothesis in a useful way. You can collaborate with an AI and still exercise judgment on ethics, values, and domain precision.
Third, outreach and communication are the unglamorous leading edge. The single highest-penetration task for Sustainability Specialists in the dataset is creating marketing and outreach materials. Not ESG modeling, not compliance analysis, not strategy. Communication content. Worth noticing before the next client deliverable.
Fourth, the widest gap is the widest opportunity. Policy analysis, restoration planning, city planning, and compliance inspection show near-zero measured AI co-occurrence. That is either because AI adds little value there, or because the profession has not tried hard enough to apply it. My read is that it is mostly the second. A related deep dive sits in how generative AI is changing the circular economy and in my piece on Claude Code for research workflows in circular economy and sustainability. The practical tooling sits in the open-source Claude Code skills hub for anyone who wants to try the workflows directly.
Limitations of this analysis
This is one dataset from one AI company, filtered two ways, with caveats every step of the road. Six limitations frame the interpretation.
- Claude-only measurement. AEI captures Claude.ai and first-party Anthropic API usage. ChatGPT, Gemini, Microsoft Copilot, and specialist sustainability platforms (Watershed, Persefoni, Sphera, Normative) are invisible. True AI usage is higher than AEI alone shows. The task-level gap could hold for all tools, or it could partly reflect that sustainability professionals favor non-Claude tools.
- Broad occupation buckets. Management Analysts, Business Operations Specialists, and Chief Executives are all bucket codes that contain far more non-sustainability work than sustainability work. The occupation lens is directional, not precise.
- Keyword-based task filtering. The 689 sustainability tasks I identified come from keyword matching. Some tasks were probably missed. Others (generic reporting and analysis tasks that sustainability professionals also do) are not counted on the sustainability side. The task lens is a subset, not a census.
- Penetration is conversational prominence, not adoption. Task penetration measures how prominently a task appears in Claude conversation clusters. A task at 14% penetration does not mean 14% of real-world instances use AI. It means that task shows up noticeably in the Claude sample.
- Temporal inconsistency. Release dates vary across files. The interaction-type breakdown reflects 2025 Claude models, the exposure rankings reflect mid-to-late 2025, and the raw API usage extends into 2026. Mixing windows can create artifacts. The June 2026 release re-measures usage with an updated methodology and a different occupation metric, so I use it as a directional cross-check on the split rather than as a restatement of the earlier exposure numbers.
- Claude’s user base skew. Tech knowledge workers, English speakers, and high-income geographies are overrepresented in the Claude user base. Sustainability professionals at traditional firms, in government, in NGOs, or in the Global South are probably underrepresented in ways this analysis cannot correct for.
None of these break the task-type gradient, which is the most defensible finding. They bound its magnitudes.
Frequently Asked Questions
I am a sustainability consultant. Does this mean I should be using AI more?
Probably yes, and probably in specific ways. If you are classified under Management Analysts or Economists, your professional family sits in the top 13 to 17% of occupations for AI exposure. The task-level data suggests your sustainability-specific work is getting far less AI leverage than your generic analytical work. Closing that gap is a readily available move. The longer read on what an AI-augmented field consultant actually does in practice walks through the operating model and three real projects.
Which sustainability tasks are actually seeing AI usage right now?
The sustainability tasks with highest AI co-occurrence in the data are environmental permit processing, economic modeling and forecasting, environmental data synthesis, research design for environmental studies, technical writing, and outreach content creation. These are the low-risk, high-leverage starting points for someone beginning to adopt AI in sustainability work.
Why do policy analysts, planners, and conservation scientists show near-zero AI co-occurrence?
Three candidate explanations sit on the table: the work is genuinely harder for general LLMs to help with (field-bound, geospatial, deeply regulatory), the profession has not adopted these tools yet, or the values at stake in those roles create more caution about AI assistance. My read is that it is mostly the second and third combined.
Is this representative of all AI usage, or just Claude?
Just Claude and first-party Anthropic API usage. ChatGPT, Gemini, Microsoft Copilot, Grok, and specialist ESG platforms are not captured. A sister analysis of AI usage in education from the same dataset shows the task-level patterns are consistent across different professional fields. For a look at the disclosure gap on a different frontier lab, see the parallel piece on whether xAI is sustainable, which reads the SpaceX S-1 for what it does and does not say about Colossus.
Where can I see the underlying data myself?
The Anthropic Economic Index is published at huggingface.co/datasets/Anthropic/EconomicIndex. I used the March 2026 and January 2026 releases plus the February 2025 O*NET task mappings for the rankings, and cross-checked the split against the June 2026 Cadences release. Everything here is reproducible from those files plus the sustainability keyword list I describe in the methodology section. Anthropic’s openness with usage data of this kind raises a separate question about the same lab’s silence on environmental data, which I covered in is Claude actually sustainable.
If you have cut this data differently and see something I missed, or want to challenge the resistance interpretation, I would like to hear it. Tell me on LinkedIn or reply directly.
From analysis to engagement
This analysis informs how we work. Our AI for Sustainability Research consulting helps sustainability and ESG teams build AI-assisted research workflows that hold up to scrutiny.