

Why do people repair things when buying new is so easy? Ask them and most name cost.
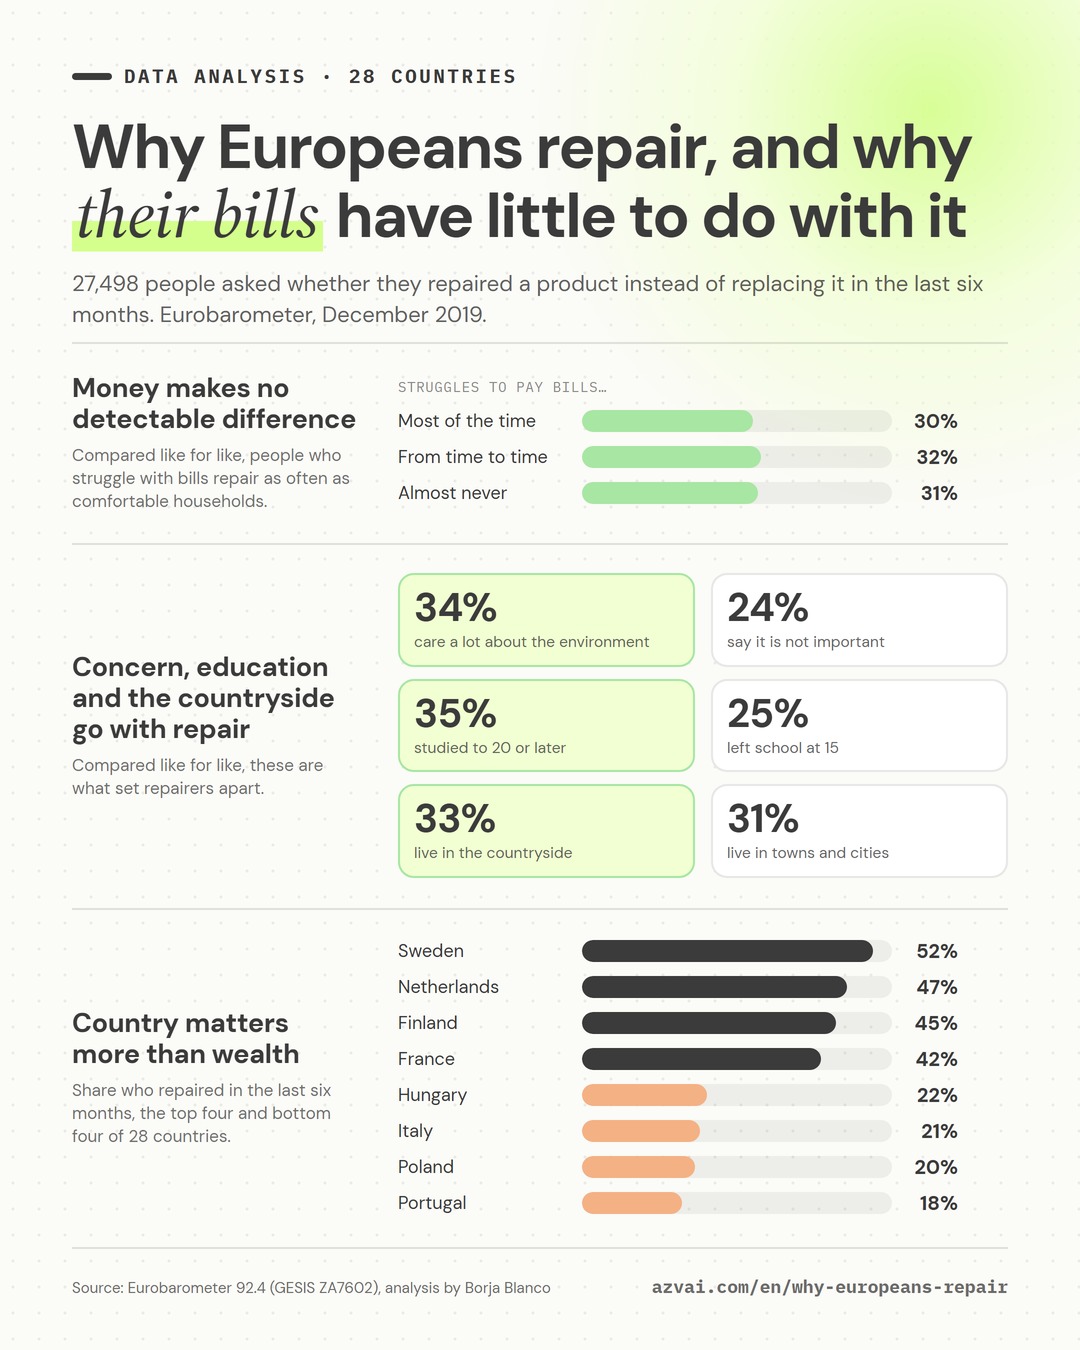
I analysed what 27,498 Europeans in 28 countries did, using their answers to the Eurobarometer question on whether they had repaired a product in the previous six months. Among people alike in country, age, education, gender, type of place and environmental concern, difficulty paying bills makes no detectable difference. About 31% repaired in each group, whether they struggled with bills most of the time or almost never.
What the data shows
- Money makes no detectable difference. Before comparing like for like, 26% of people who struggle with bills most of the time repaired something, against 34% of those who almost never struggle. That gap disappears once the groups are otherwise alike.
- Concern and education go with repair. People who care most about the environment, and people who stayed longest in education, repair the most.
- The countryside repairs a little more, once age and education are taken into account.
- Country matters more than wealth. Sweden repairs at 52% and Portugal at 18%, and countries of similar wealth sit far apart.
The survey dates from December 2019, the most recent large European survey I could find that records whether people actually repaired. I add the 2024 Eurobarometer, plus two 2025 studies (NIM’s seven-country survey and the Welsh Government’s repair evaluation).
Do people who struggle with bills repair more?
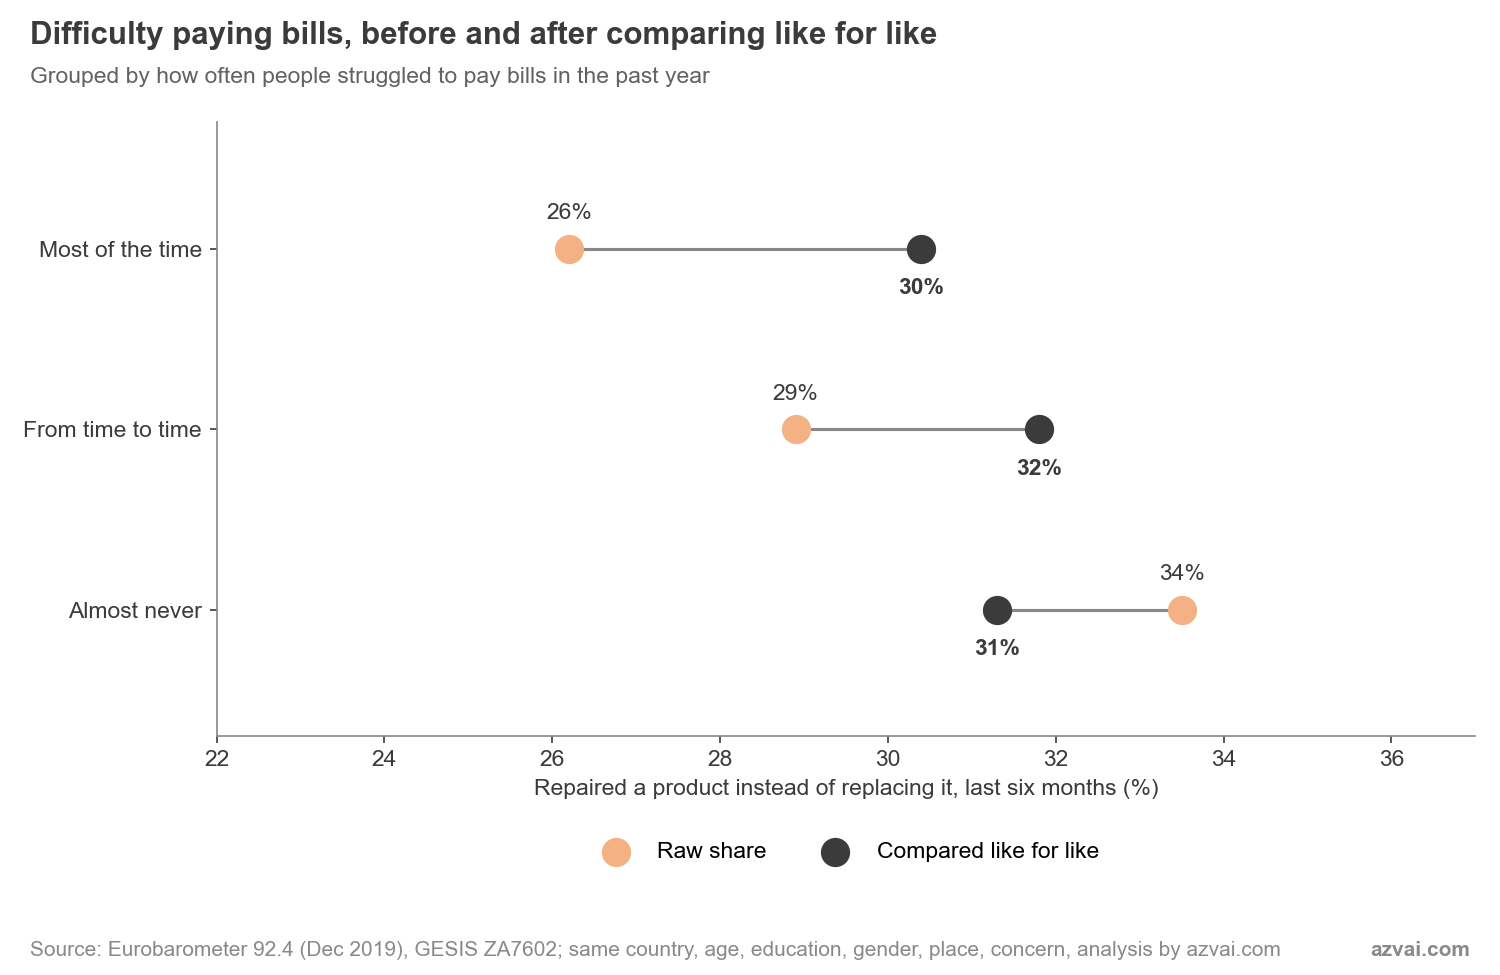
If repair were mainly a money decision, people short of money should repair the most. The raw numbers point the other way. The share who repaired a product in the last six months, by how often people struggle to pay their bills:
- Most of the time, 26.2%
- From time to time, 28.9%
- Almost never, 33.5%
That eight-point gap comes from other differences between the groups. People who struggle most with bills are concentrated in countries where repair is less common, such as Greece, Bulgaria and Portugal. They also stayed in education for less time, with one in five studying to age 20 or beyond against two in five of those who rarely struggle.
So I compared like for like. That means comparing people who live in the same country and share the same age group, education, gender, type of place (rural, town or city) and level of environmental concern, so that the only difference left between them is how often they struggle with bills.
On that basis the three groups repaired at 30.4%, 31.8% and 31.3%. Households that struggle repair about as often as comfortable ones.
How solid is this? Strong. It rests on the 26,389 of the 27,498 people interviewed who answered every question used in the comparison, and the remaining differences between the groups are smaller than the data can reliably detect.
Within many countries the comfortable repair a bit more before adjustment (in 15 of the 21 countries with enough struggling respondents to check). Across the whole sample, that difference disappears once age, education and concern are equal as well.
This is the gap between what people say and what they do. Cost is the top stated reason for and against repair in the 2025 survey by NIM (the Nuremberg Institute for Market Decisions), and in the EU’s Consumer Conditions Scoreboard 2025, cost was the most frequent reason (61%) among people who chose not to repair a broken product outside its guarantee. Yet in what people actually did, financial pressure shows no detectable difference between repairers and non-repairers.
What actually goes with repairing?
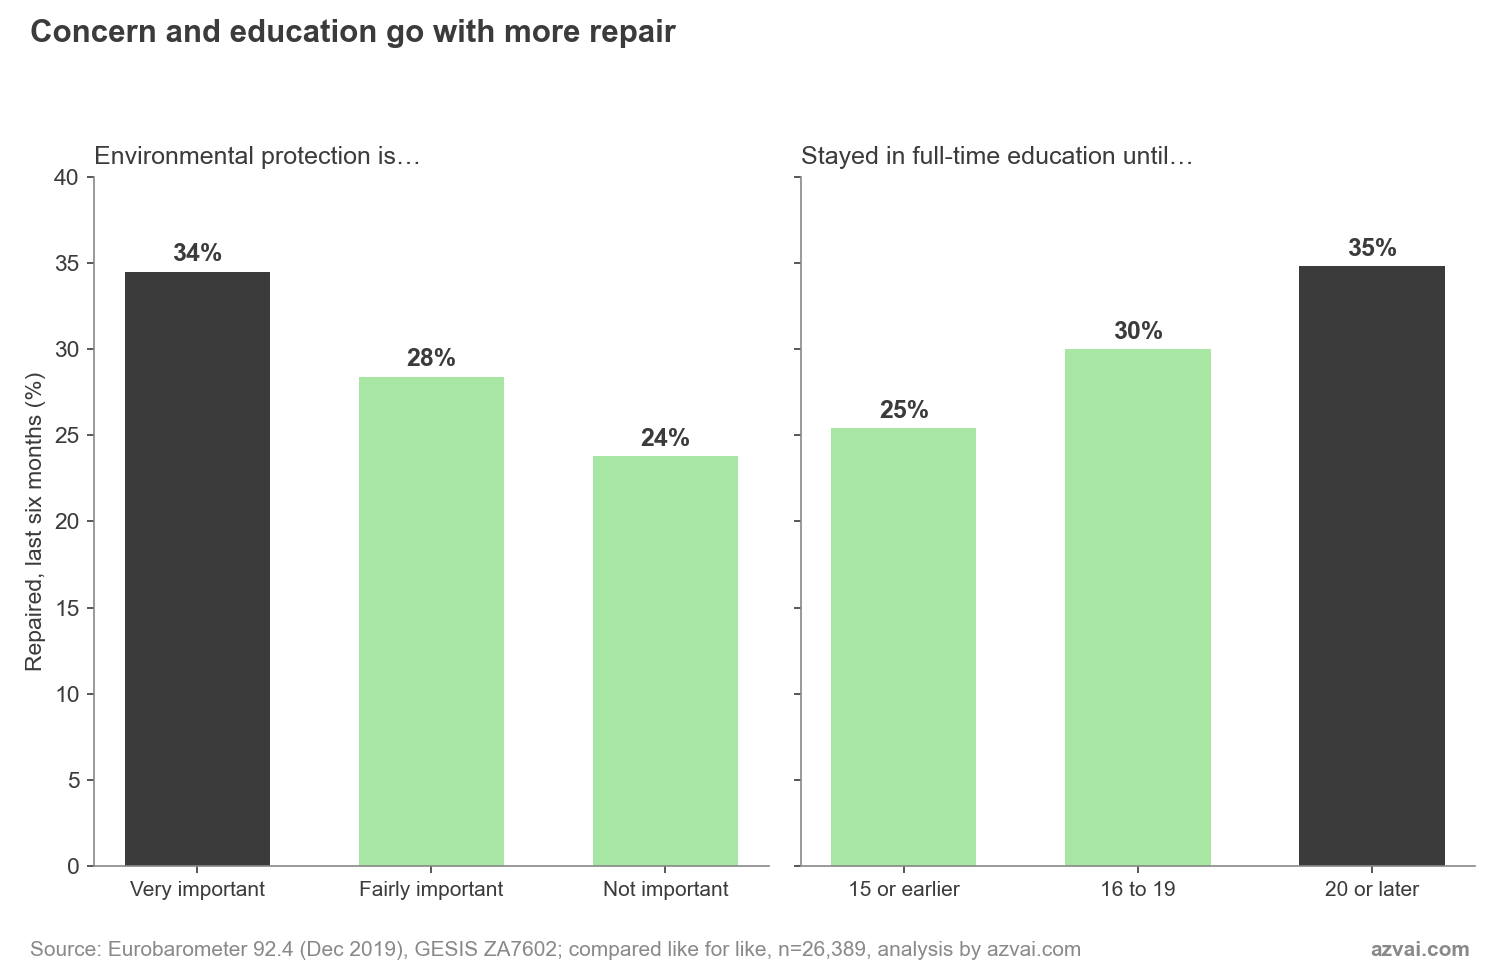
Environmental concern draws the clearest line through the data. Among people who say protecting the environment is very important to them, 34.5% repaired something in six months, compared like for like. The figure drops to 28.4% for “fairly important” and 23.8% for “not important”.
How solid is this? Strong. The difference is large and holds when people are compared within the same country.
Three other factors go with repair, all compared like for like:
- Education. People who stayed in full-time education until 20 or later (roughly, a university education) repaired at 35%, against 30% for those who left at 16 to 19 and 25% for those who left at 15 or earlier. Strong.
- Place. Rural residents repaired at 33%, against 31% in towns and cities. In the raw numbers the two are level, because rural residents are older and stayed in education for less time, which goes with less repair. With those differences equal, the rural lead appears, and it holds when self-rated social class is added as a second measure of money. Moderate, because the gap is small and rural people repair more in only about half the countries.
- Age. Repair peaks at 40 to 54 (34%) and is lowest at 15 to 24 (27%). Moderate.
My reading, which the data cannot prove, is that repair follows skills, tools, time and space. Space would explain part of the rural pattern, since a shed, a garage or a yard makes repairing at home easier, and the nearest repairer is often further away. Other studies fit that reading. In the 2016 global survey of repair cafés (Charter and Keiller, Centre for Sustainable Design), covering 317 cafés in 10 countries, 75% of volunteers held at least a first degree, 42% were women and the largest age group was 56 to 65. A nationally representative Finnish survey of 1,000 people (Lundberg and colleagues, 2024) linked willingness to build repair skills to education and environmental concern.
Men also reported repairing somewhat more often than women in this survey, though it does not say what was repaired, and the pattern changes with the product. A Spanish telephone survey of 400 people about small household appliances (Pérez-Belis and colleagues, 2017) found women more likely to repair. Who repairs probably depends on the product and on who does the fixing.
Which countries repair more than their wealth predicts?
Sweden and Italy are both wealthy, yet 51.7% of Swedes had repaired something in six months against 20.9% of Italians.
Sweden, the Netherlands (47.1%), Finland (45.0%) and France (42.4%) lead. Portugal (17.8%), Poland (20.0%) and Italy trail. The EU28 average is 31.7%. Richer countries repair a little more, and national wealth explains statistically under a third of the differences between countries.
To compare countries fairly, I worked out a rate expected from wealth for each one. It is the repair rate a country of that wealth would have if repair tracked GDP per person. The gap is the actual rate minus that expected rate.
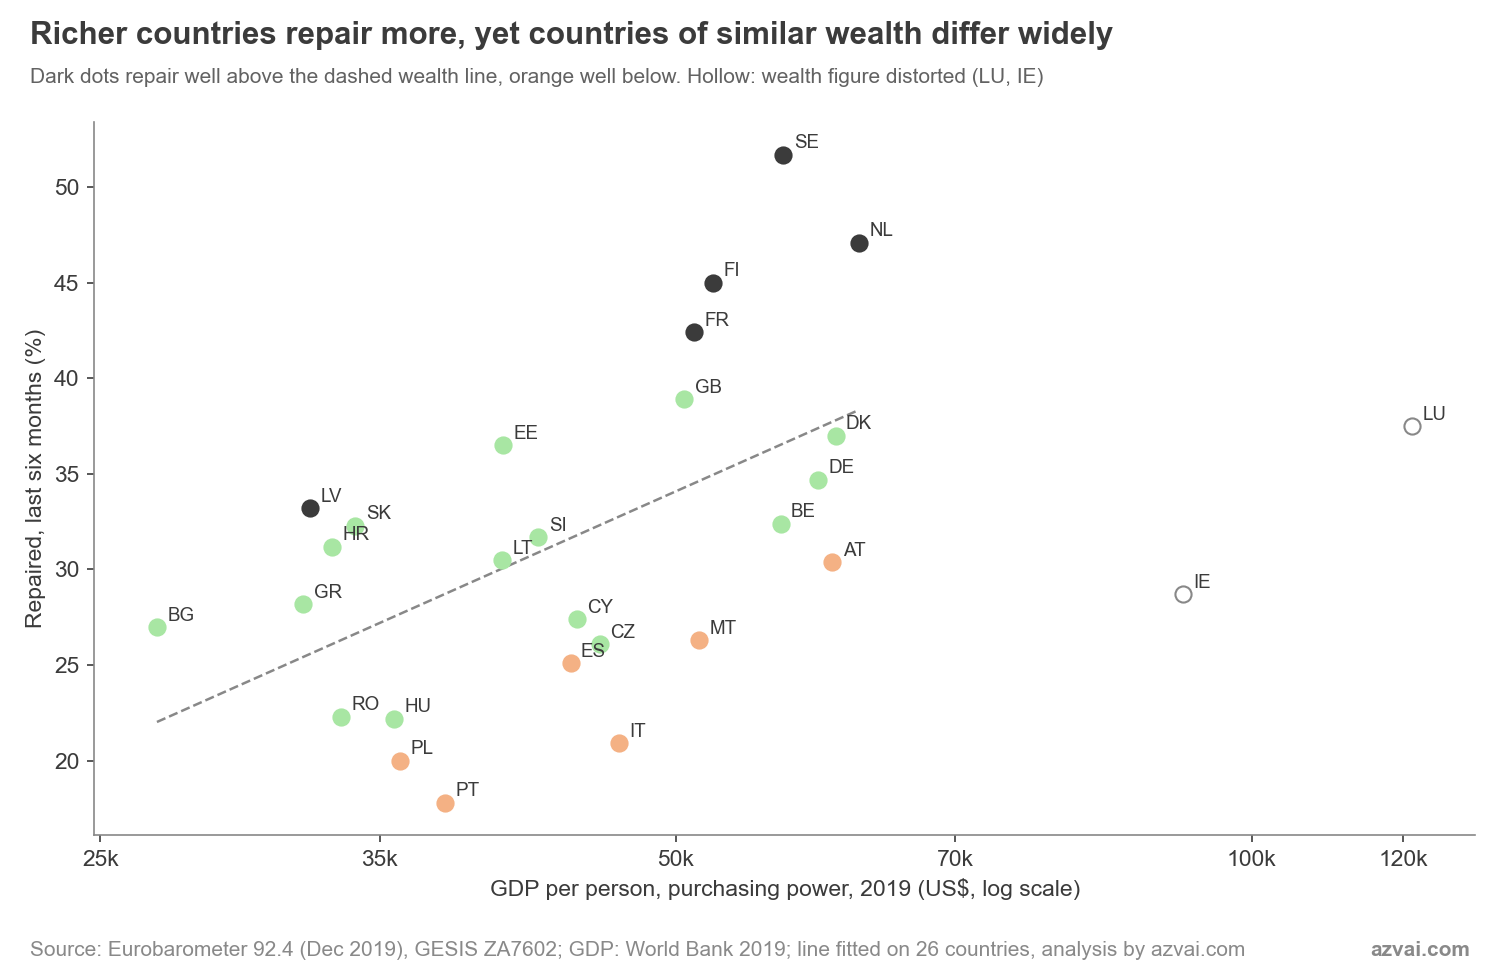
Countries that repair more than their wealth predicts, in percentage points:
- Sweden +15
- Finland +10
- Netherlands +9
- France +8
Countries that repair less than their wealth predicts:
- Italy -12
- Portugal -11
- Malta -8
- Poland -8
- Austria -7
- Spain -7
Holding bill difficulty equal does not close these gaps. Among people who almost never struggle with bills, repair still ranges from 19.5% in Poland to 51.1% in Sweden, with Italy at 21.5%, Spain at 24.5% and the UK at 38.4%. Comfortable Poles and Italians repair at less than half the Swedish rate.
How solid is this? Moderate. The country gaps are large and clear, but “repaired a product” may be understood differently across 28 countries and their languages.
Repair culture, the supply of repair services and the mix of products people own are all candidate explanations, and this survey cannot separate them.
| Country | Repaired (%) | Expected from wealth (%) | Gap |
|---|---|---|---|
| Sweden | 51.7 | 36.6 | +15.1 |
| Finland | 45.0 | 34.9 | +10.1 |
| Netherlands | 47.1 | 38.3 | +8.7 |
| France | 42.4 | 34.5 | +7.8 |
| Latvia | 33.2 | 25.6 | +7.6 |
| Estonia | 36.5 | 30.1 | +6.4 |
| Slovakia | 32.3 | 26.6 | +5.6 |
| Croatia | 31.2 | 26.1 | +5.1 |
| Bulgaria | 27.0 | 22.0 | +5.0 |
| United Kingdom | 38.9 | 34.3 | +4.7 |
| Greece | 28.2 | 25.4 | +2.8 |
| Slovenia | 31.7 | 30.9 | +0.8 |
| Lithuania | 30.5 | 30.0 | +0.4 |
| Denmark | 37.0 | 37.8 | -0.8 |
| Germany | 34.7 | 37.4 | -2.7 |
| Romania | 22.3 | 26.3 | -4.0 |
| Belgium | 32.4 | 36.5 | -4.1 |
| Cyprus | 27.4 | 31.8 | -4.4 |
| Hungary | 22.2 | 27.5 | -5.3 |
| Czechia | 26.1 | 32.3 | -6.2 |
| Spain | 25.1 | 31.6 | -6.5 |
| Austria | 30.4 | 37.7 | -7.3 |
| Poland | 20.0 | 27.7 | -7.7 |
| Malta | 26.3 | 34.6 | -8.3 |
| Portugal | 17.8 | 28.7 | -10.9 |
| Italy | 20.9 | 32.7 | -11.8 |
| Luxembourg * | 37.5 | 51.2 | -13.7 |
| Ireland * | 28.7 | 45.9 | -17.2 |
* Luxembourg and Ireland were left out of the wealth line because multinational accounting inflates their GDP figures, so their expected rate and gap are shown for completeness only. The expected rate is the share a country of that wealth would have if repair tracked GDP per person (World Bank, PPP, 2019), and the gap is in percentage points. GDP figures are in the downloadable table. About 1,000 people were interviewed in each country (around 500 in Cyprus, Luxembourg and Malta, and 1,500 in Germany). Repair shares use the survey weights. Gaps are calculated before rounding, so a few differ by 0.1 from the rounded columns. Download the country table (CSV) to reuse these figures. The raw survey data is available from GESIS under its own terms (doi 10.4232/1.14381 and 10.4232/1.14518).
If most Europeans want easier repair, why do so few repair?
In the same 2019 survey, 80.4% of people said manufacturers should be required to make digital devices easier to repair. Of those people, 34.9% had repaired something in the previous six months, barely above the 31.7% average.
How solid is this? Strong. Both answers come from the same respondents, so this is a direct comparison.
My interpretation is that the people who act combine concern with the means to act on it, such as skills, time and a repairer nearby.
Where does money matter for repair?
Financial comfort goes with willingness to pay more. In the 2024 Eurobarometer, willingness to pay more for products that are easier to repair, recyclable or sustainable climbs steeply with ease paying bills:
- 40.9% of people who struggle with bills most of the time
- 50.3% of those who struggle from time to time
- 63.7% of those who almost never struggle
How solid is this? Strong. The sample is large, the step pattern is clear and it is close to the official report (41%, 51% and 65%).
NIM’s NIMpulse 11 study surveyed 14,000 adults in seven countries in 2025. Most people draw the line at a repair costing about 15 to 20% of the price of a new product. NIM also reports that people with higher incomes and more education more often find repair too much effort compared with buying new.
How solid is this? Moderate. These are stated reasons from an online panel.
Why do our results differ from other repair surveys?
NIM’s 2025 study puts Italy highest for repair (61%), with France (43%) and Germany (41%) lowest. The 2019 Eurobarometer has Italy near the bottom (20.9%) and France near the top (42.4%). Both can be right, because they count different things.
| Survey | NIM 2025 | Eurobarometer 2019 |
|---|---|---|
| Counts | Repairs done by someone else | Any repair, including your own |
| Products | Electrical devices | Any product |
| Time window | 12 months | 6 months |
| Sample | Online, ages 18 to 74 | Face to face, ages 15+ |
| Year | 2025 | 2019 |
To illustrate the two designs, an appliance repaired by a shop under warranty counts in NIM, and a bicycle fixed at home counts only in Eurobarometer. My explanation, which NIM does not state, is that a country with a strong paid repair trade for appliances can rank high on NIM and lower on a broad “did you repair” question.
The surveys also measure different kinds of answer. NIM and the Welsh Government’s 2025 evaluation of repair and reuse ask people for their reasons, and both find cost the strongest stated motivator. My analysis looks at what individuals did, where bill difficulty shows no detectable difference. Stated reasons and recorded behaviour can both be accurate and still point in different directions.
How solid is this? Interpretation. The design differences are documented, and how much each one explains is my judgement.
What does this mean for repair policy and community repair?
Repair vouchers have a mixed record.
- Austria’s Reparaturbonus redeemed about 1.7 million vouchers, with EUR 130 million provided since 2022, until the money ran out and new vouchers paused on 26 May 2025, according to Austria’s environment and climate ministry (BMLUK).
- France’s Bonus Réparation used only 19% of its 2024 budget, according to the French consumer association CLCV (CLCV observatory, 2025).
- NIM found no higher repair rates in countries with national subsidy schemes, while German states with a regional bonus sat slightly above average. Neither snapshot proves cause.
How solid is this? Moderate. Uptake figures are administrative, and I found no published evaluation of who used the vouchers or whether they added repairs.
My own view, which goes beyond what the data can show, is that the pattern points policy design toward skills, visibility and local repair capacity alongside price support. Policy cannot hand out education or concern, but it can fund repair training, findable listings of repairers and local workshops. I set out how these pieces fit together in designing circular economy systems.
Scotland offers a worked example of a national community repair network with public numbers. Its Share and Repair Network counts 63 repair groups (motion S7M-01309), in 26 of the 32 council areas according to Circular Communities Scotland, within the wider Scottish circular economy system. In the Welsh evaluation, 46% of 71 surveyed users named connecting with others as a key benefit of community repair, and 28% of non-users did not know where activities happen.
Directive (EU) 2024/1799 had to be transposed by 31 July 2026. It requires manufacturers to repair covered products on request, adds a European Repair Information Form and asks each Member State for at least one repair-promotion measure. Obligations on producers are where repair meets the take-back logic I described in scaling a take-back programme across European markets.
For community-based circular economy work, the test for each national measure is practical. Does it pay for volunteer and technician training, a listing that tells people where repair happens, and space for local workshops?
How I put this together
I analysed two Eurobarometer surveys from the GESIS data archive (the Leibniz Institute for the Social Sciences). The main one is Eurobarometer 92.4, 27,498 face-to-face interviews in the EU28 including the UK in December 2019, which asked whether people had repaired a product instead of replacing it in the past six months. The second is Eurobarometer 101.2, 26,332 interviews in the EU27 in spring 2024, which asked about paying more for repairable products. Money is measured as how often people struggle to pay bills.
Comparing like for like means a statistical model that holds country, age, education, gender, type of place and environmental concern equal, on the 26,389 people who answered every question used. Countries are set against World Bank GDP per person for 2019, leaving out Luxembourg and Ireland. Shares use the survey weights, and the country figures are in the downloadable table.
What are the limits of this analysis?
- Repair is self-reported over six months, as one yes or no item in a list of green actions, which may nudge environmentally minded people to say yes.
- The data is from 2019, and inflation since 2022 could have shifted things. The 2024 data covers willingness to pay, not repair.
- “Repaired a product” is asked in the national languages of 28 countries, covers both self-repair and paid repair, and says nothing about which product.
- Bill difficulty measures financial pressure, not income.
- These are associations. Country, education and concern travel together, and comparing like for like cannot rule out hidden factors.
- The country wealth line excludes Luxembourg and Ireland, whose GDP is distorted by multinational accounting.
- Official counts of repair businesses were left out, because national registers classify repair differently.
- The UK is included in 2019 (EU28) and absent from 2024.
FAQ
Why do people repair things instead of replacing them?
Repair goes most clearly with caring about the environment. In the 2019 Eurobarometer, about a third of people who rated environmental protection very important had repaired something in six months, against under a quarter of those who did not. Longer education, rural living and middle age also go with repair, which fits a reading where skills, time and space matter.
Is repairing mainly about saving money?
People say so, and cost is the top stated reason in recent surveys. Their behaviour tells a different story. People who often struggle with bills repaired about as often as comfortable households (around 31% each) once other differences between them were equal.
Which European country repairs the most?
Sweden, at 52% of people repairing a product in six months in late 2019, followed by the Netherlands (47%) and Finland (45%). Portugal (18%), Poland (20%) and Italy (21%) repaired least. Table 1 lists all 28 countries.
Do repair vouchers increase repair?
No published evaluation I found shows it. Austria’s scheme ran out of money in May 2025 after about 1.7 million vouchers, and France used under a fifth of its 2024 repair bonus budget. A 2025 seven-country survey found repair rates no higher where national subsidies exist.
Why does Italy rank high in some repair surveys and low in others?
Because the surveys count different repairs. NIM’s 2025 study counts electrical devices repaired by someone else over a year, and Italy leads. Eurobarometer counts any product, including home repairs, over six months, and Italy sits near the bottom.
Can I use your data?
Yes. Download the 28-country table as a CSV and cite this page. The individual survey answers belong to GESIS and are available from its archive under its own terms.