The Anthropic Economic Index is one of the few public datasets that lets us see, at scale, what people actually use AI for. Anthropic publishes anonymized aggregate data from millions of Claude conversations, mapped to the U.S. Department of Labor’s O*NET task taxonomy. Five releases since February 2025 have made it the most comprehensive open record of AI adoption available.
This page is a reading of the latest release (March 2026, “Learning curves”) through a deliberately broad lens. We look at where AI is showing up across the economy, where it is essentially absent, and what the data does and does not tell us. For sector-specific deep dives, we link to longer pieces below: sustainability work and education.
What the index actually measures
For each of the roughly 18,000 task statements in the O*NET taxonomy, the Index records whether and how often that task appears in observed Claude conversations. The result is a per-task “penetration” score, plus an occupation-level “exposure” score that aggregates across all the tasks an occupation typically performs.
The dataset is not a survey. Nobody self-reports. The classification is automated by Anthropic’s Clio system, which clusters and labels conversations while preserving privacy. That makes the data unusually direct: it shows behavior, not stated intent.
Headline finding: most work tasks still have no measurable AI usage
The first thing that stands out is how much of the economy is untouched. Of the 17,998 O*NET tasks tracked in the latest release, 16,644 (92.5%) show zero measurable Claude usage. Only 1,354 tasks, or about 7.5%, register any meaningful penetration.
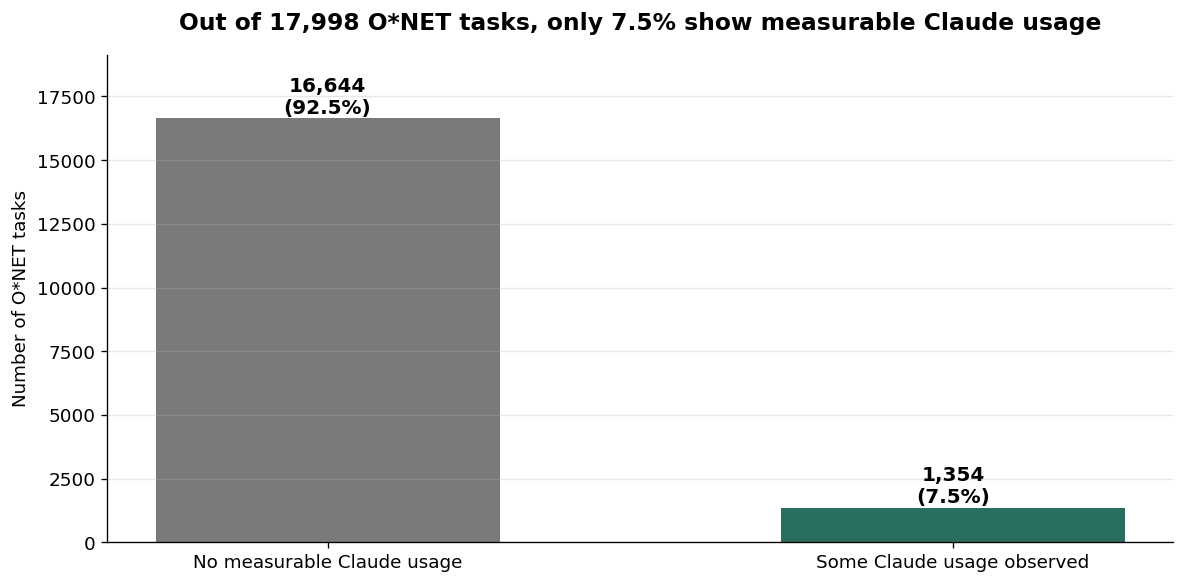
This is worth pausing on. Headline narratives about AI tend to suggest pervasive adoption. The data shows something more specific: AI is heavily used for a small slice of work, and almost completely absent from the rest. Whether that ratio shifts over time is the real question Anthropic is trying to answer with successive releases of this index.
Where AI clusters: knowledge work, computer-related tasks, and education
The slice that does show meaningful usage is concentrated in a few occupational major groups. Computer and Mathematical Occupations, Educational Instruction and Library Occupations, and Sales sit at the top. Physical-world work sits at the bottom.
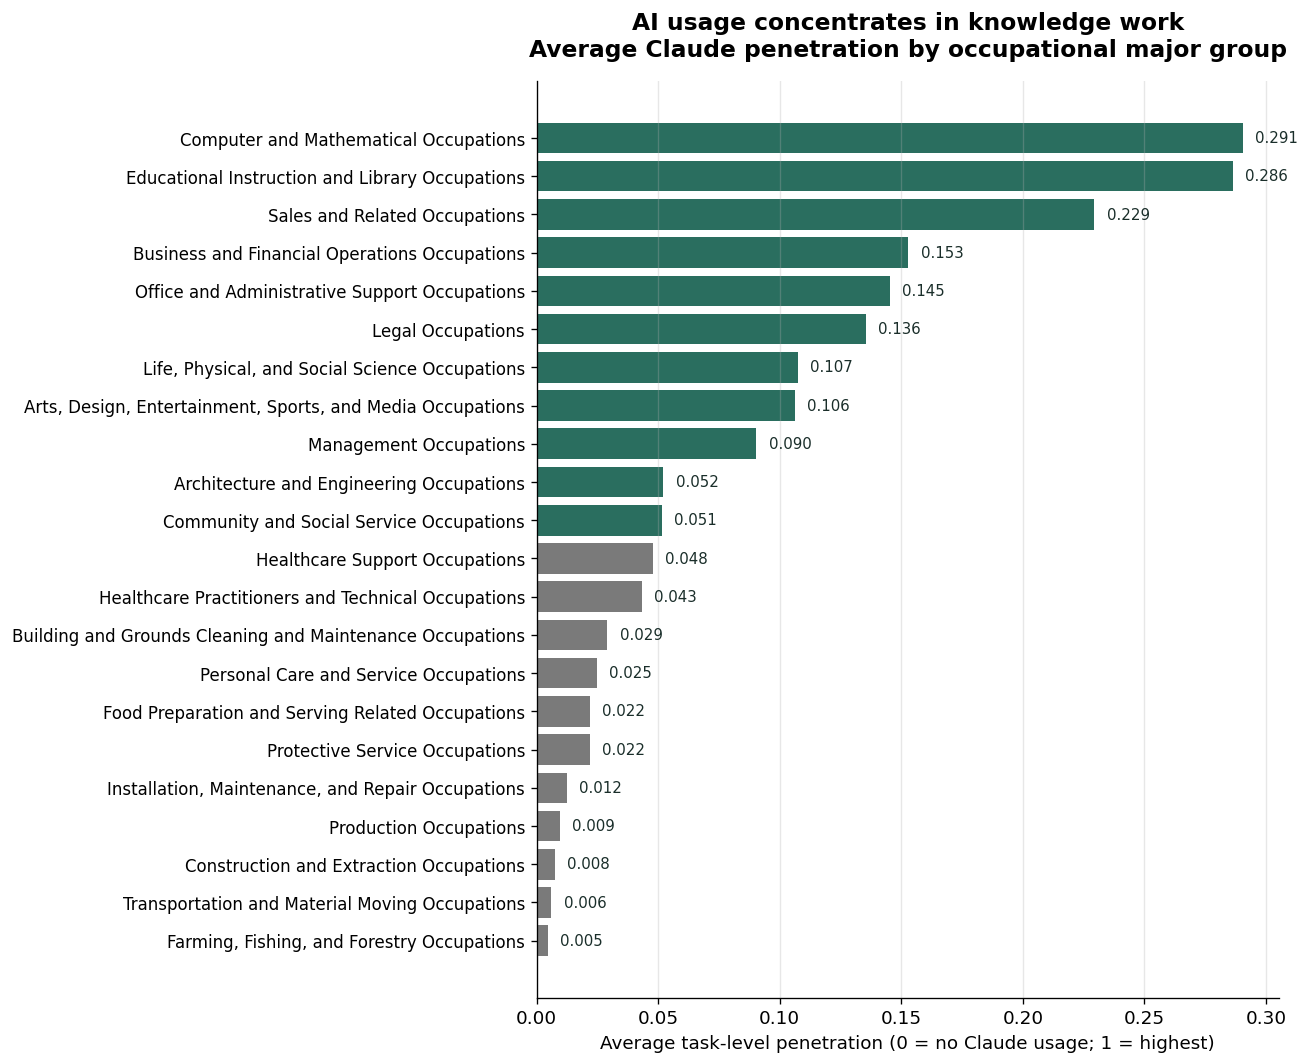
The gap is more than three orders of magnitude between Computer/Math at the top (0.291 average) and Farming, Fishing, and Forestry at the bottom (0.005). Construction, Transportation, and Production Occupations cluster near zero with them. None of this is surprising given how Claude is used (text and code) but seeing the gradient mapped to occupational categories makes it concrete.
Top 10 occupations by observed exposure
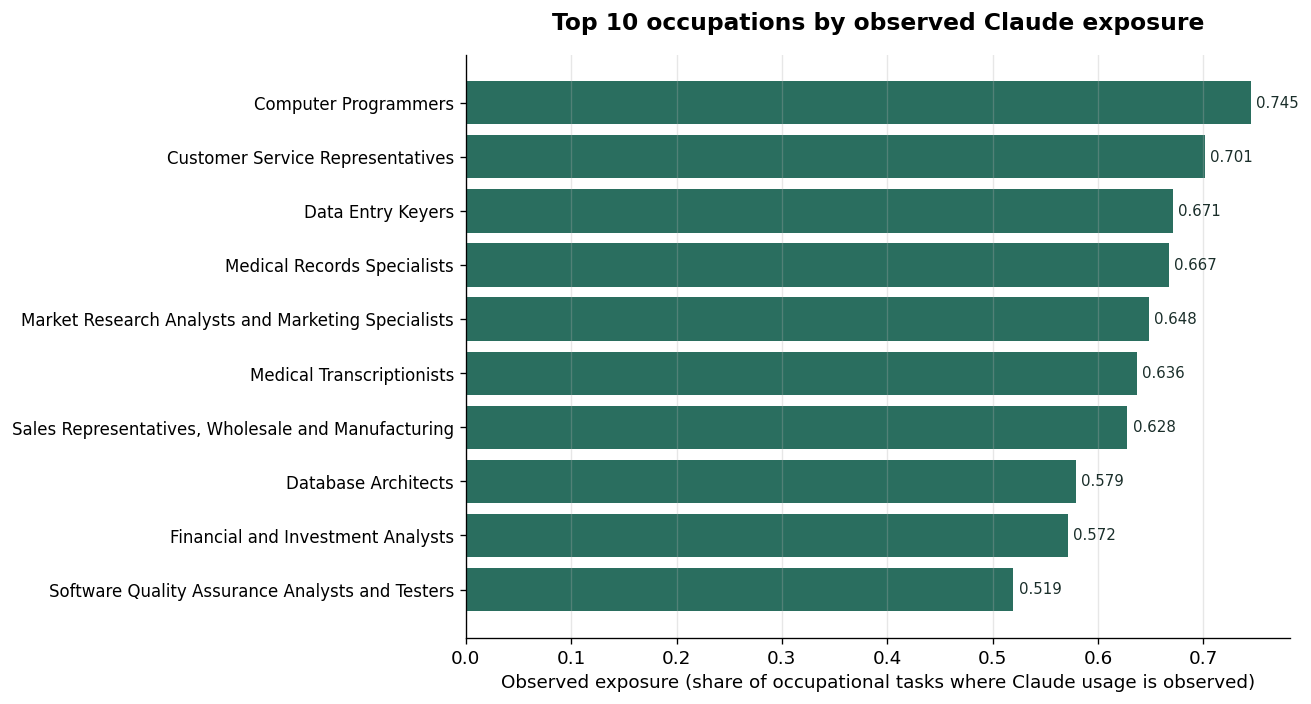
The top of the list is not a surprise. Computer Programmers (0.745) and Customer Service Representatives (0.701) are the two highest-exposure occupations. Data Entry Keyers, Medical Records Specialists, and Market Research Analysts round out the top five. What these have in common is that the bulk of their work output is text or code, the kinds of artifacts an LLM can produce directly. That is consistent with what the use-case data shows: Claude is mostly being used to generate, edit, classify, or interpret text and code.
The gap between AI-heavy and AI-light work
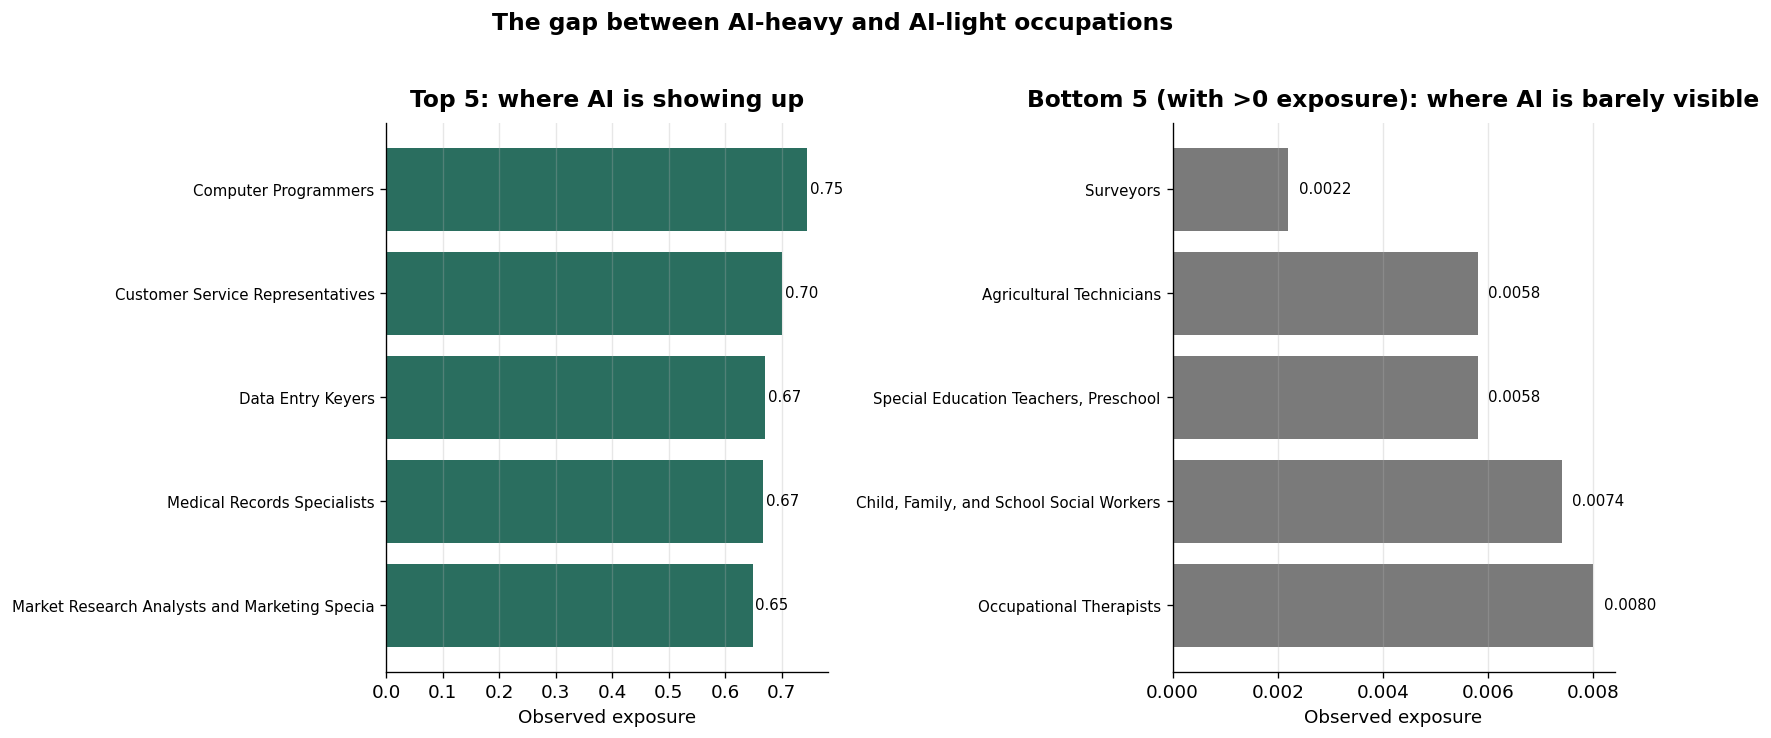
The contrast is striking. 411 of the 756 occupations Anthropic tracks (54%) show zero observed Claude exposure in this release. These are mostly hands-on physical occupations (skilled trades, transportation, agriculture, food service). For now, the AI-adoption story is happening on one side of a fairly clean line between work that produces text or code and work that produces physical artifacts and services.
Reading the data through different lenses
Research-heavy work
Within the Life, Physical, and Social Sciences major group, the pattern follows the text-vs-physical line. Political Scientists (0.452), Survey Researchers (0.432), Sociologists (0.383), and Astronomers (0.385) are at the top. Chemists (0.261) and Physicists (0.273) are in the middle. Conservation Scientists (0.000) sit at the bottom. Tasks that involve synthesizing literature, analyzing surveys, or writing reports show up; tasks that involve fieldwork or wet-lab procedures do not.
Operations and analytical work
Business and Financial Operations is the second-highest knowledge-work group (0.153 average), driven by Market Research Analysts (0.648), Financial and Investment Analysts (0.572), Human Resources Specialists (0.403), and Training and Development Managers (0.378). Operational Excellence and process improvement work, where the deliverable is typically analysis, reports, training material, or written recommendations, fits the profile of work AI shows up in. Operational work that lives on a factory floor or in a delivery vehicle does not.
Sustainability and environmental work
Sustainability-related occupations show notably low exposure relative to other knowledge work. Environmental Scientists are at 0.055, Geoscientists at 0.043, Conservation Scientists at 0.000, Urban and Regional Planners at 0.096, Natural Sciences Managers at 0.061. The pattern is clear: AI adoption in sustainability fields lags AI adoption in business analysis or computer work by an order of magnitude.
For a longer treatment of why this gap matters and what it implies for sustainability practitioners, see our deep dive: AI Usage in Sustainability Consulting: an Anthropic Index analysis.
Education
Education sits high (0.286 group average), but not uniformly. Postsecondary teaching shows the most usage: Mathematical Science Teachers (0.430), Curators (0.412), Tutors (0.408), English Language and Literature Teachers (0.362). K-12 instruction lags. The shape of usage suggests AI is being applied where the deliverable is content (lecture material, exam questions, tutoring conversations) rather than direct classroom interaction.
For the full education breakdown, see AI in Education: a deep dive into generative AI usage data.
Ethics, fairness, and what the data hints at
The shape of adoption raises a fairness question that is uncomfortable to say plainly. AI is being used most by occupations that already command higher wages and more autonomy: programmers, analysts, financial professionals, postsecondary teachers. AI is barely visible in lower-wage frontline occupations. If AI continues to compound advantages where it is already adopted, the productivity gap between knowledge workers and frontline workers may widen rather than narrow. Anthropic’s own analysis flagged this in the second release, noting AI adoption skews to mid-to-high wage roles.
That is one reading of the data. Another, equally valid, is that text and code are simply the easiest modalities to automate first, and that physical-world work is harder for separate reasons (sensors, robotics, deployment cost) that have nothing to do with worker capability or wages. The data does not arbitrate between these readings. It shows what is, not why.
Limits of this kind of analysis
A few caveats worth holding in mind:
- The dataset reflects Claude usage, not all AI usage. ChatGPT, Gemini, Copilot, and others are not in here. Patterns may differ across providers.
- It captures conversations, not outcomes. A high penetration score for a task means people are asking Claude to help with it, not that the help was useful.
- O*NET’s task taxonomy is U.S.-centric and a few years out of date. Some emerging job categories are underrepresented.
- The “penetration” measure is normalized and coarse. Most tasks score either zero or somewhere between 0.1 and 1.0; it is not a precise percentage of conversations.
Explore the data yourself
The Looker Studio dashboard below loads the latest release into an interactive interface. You can filter by Major Group, Minor Group, Broad Occupation, or Job Title, drill into specific occupations, and see the underlying task list with penetration values.
If you would rather work with the data directly, you can download the joined CSV (task name, penetration, Job Title, Broad Occupation, Minor Group, Major Group) here: anthropic_economic_index_2026_03_24.csv (3.9 MB, 16,693 rows; March 2026 release).
Definitions:
pct: Task-level penetration score (0 to 1) from the Anthropic Economic Index.
Occupations Hierarchy: Major Group > Minor Group > Broad Occupation > Job Title (U.S. Standard Occupational Classification, 2018 / O*NET).
Sources
- Anthropic Economic Index home page
- 5th release report (March 2026, Learning curves)
- Open dataset on Hugging Face
- O*NET Resource Center
Building research workflows like this for your team
This kind of public-data analysis is core to how we work. We help sustainability and research teams build AI-assisted workflows that hold up to scrutiny: tool-agnostic methodology, citation discipline, and the habit of asking what the data does not show.